
Anyone who has considered having a baby or reads general interest publications has certainly come across stories about much babies cost. The answer is usually something like, “Hundreds of thousands of dollars until they are 18”. This answer is nearly useless because no one is going to dive that number by 18 to get an annual figure, much less by 18*12 to get a monthly one. I cannot recall any article that states something like, “A baby will add $100/month of food, $80/month for clothing, and don’t even think about daycare.” Before my baby was born, I even asked a financial planner we hired how much to budget, and the answer was, “Baby’s don’t require that much money.” That planner lived in the Deep Midwest and had four kids, so I should have found a better planner. Anyway, the point is simply there is not really good data out there on this question, so I set out to figure it out myself.
I have kept a detailed budget since July 2019 using Google Sheets. I never found off the shelf tools like Mint satisfying because they have difficulty categorizing from credit card statements, I don’t want to give my financial login info to anyone if I don’t have to, and there are so many edge cases, like restaurant charges split with friends or Target receipts that should be split across multiple categories, that I felt like all edges. I therefore switched over to Google Sheets – not Excel because I had a fantasy of my wife contributing to this hobby chore – and made a workbook containing several sheets. The first sheet is a dashboard that contains our gross income, estimates of costs drawn from the other sheets, housing fixed costs, and emergency savings. Every other sheet is its own category. I chose categories of groceries, eating out, entertainment, household expenses, vacation, Chestnut (pet), insurance, vehicle, subscriptions (Netflix, credit card annual fees, etc.), and, since June 2022, baby.
Note that housing is not a category here. Except for a special assessment for our condo, the costs are fixed, so it is added into the dashboard but not tracked monthly. Repairs, like the assessment or electrical work, go under the household expenses category.
I then wrote an R script that makes figures for overall spend and spend per category by month. Each figure contains a line for the spend, a line for moving average, and a flat line for the overall average. I run this R script periodically, about once per year, just to check in. I recently analyzed the budget again, updated the script to report figures as percentage of income, and broke out the baby costs into three distinct periods, giving me the inspiration for this post.
Below is the main result. We have spent almost an extra $2100 month, or 9% of income (the dotted line), on our child.
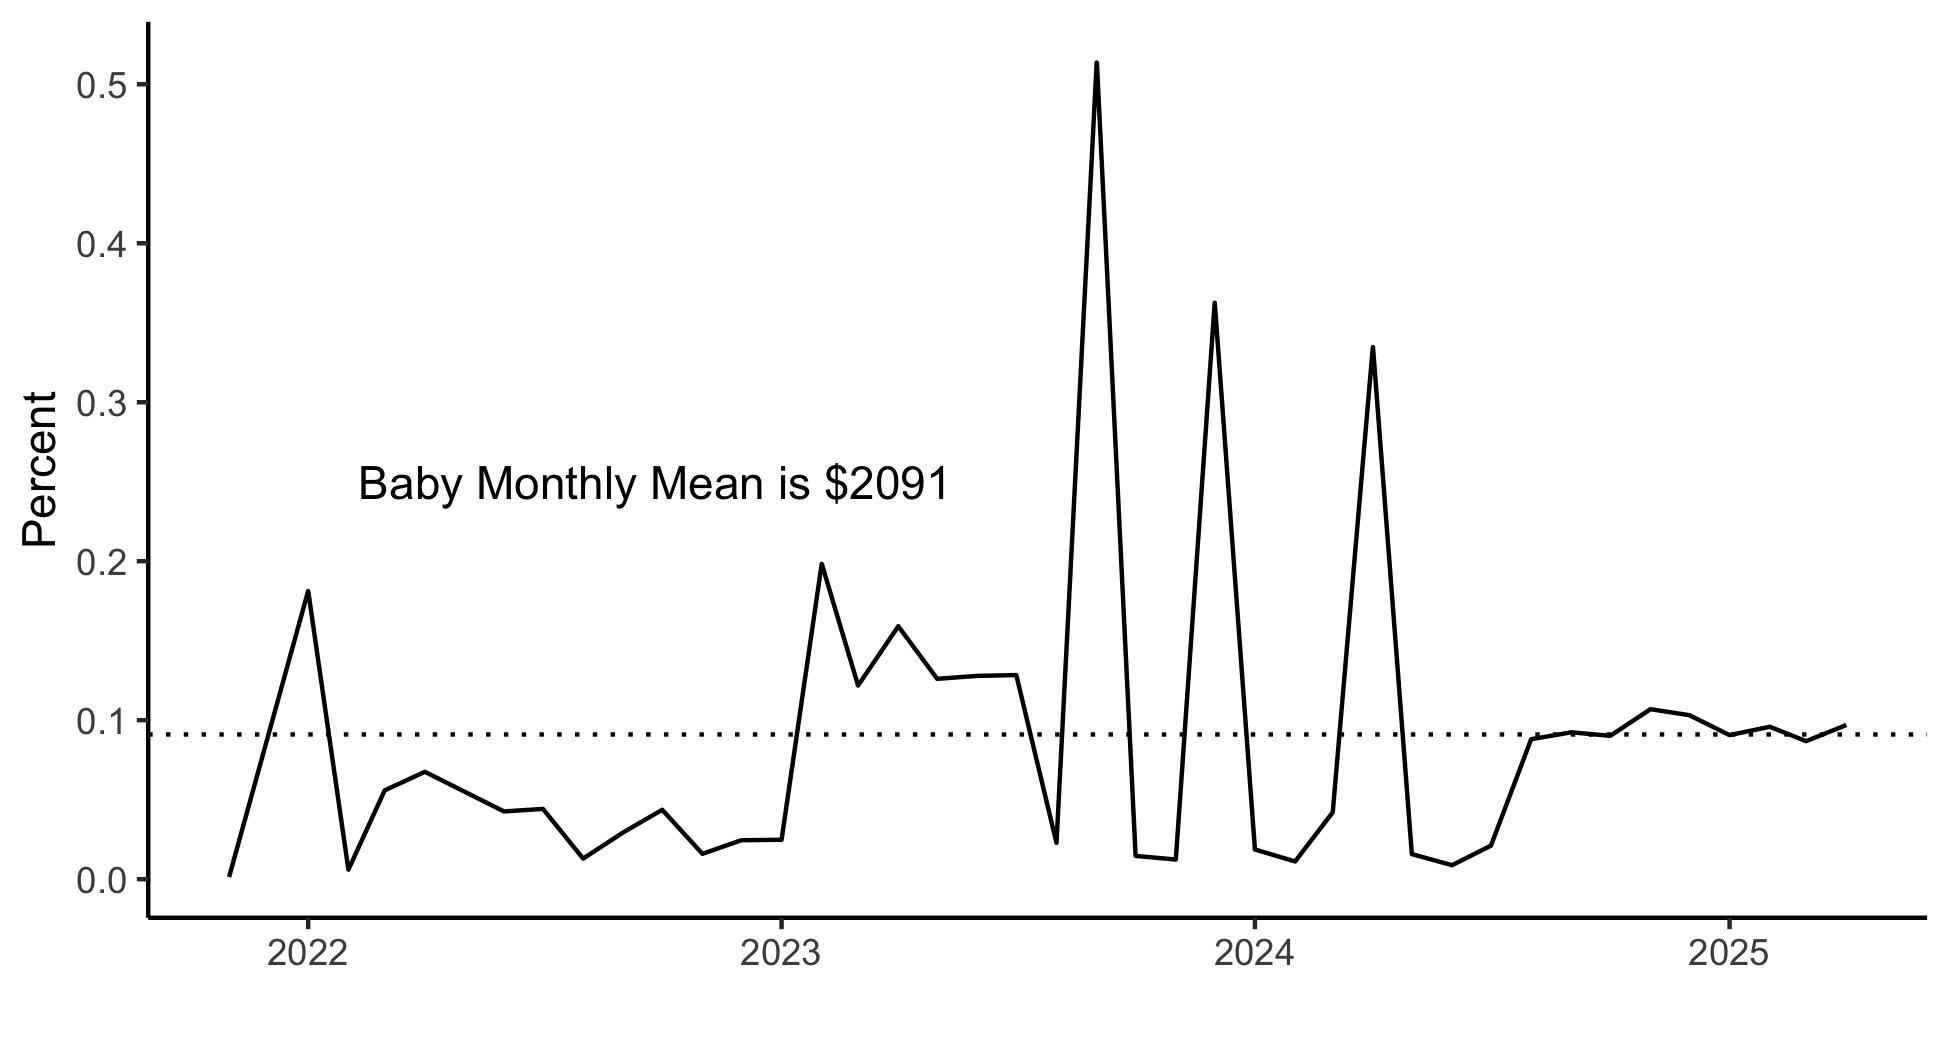
The eagle eyed reader will notice several trends in those figures. The baby was born June 2022, so there is a spike in expenses that reflect getting ready. Then, everything is not very expensive until the start of 2023. Daycare started March 2023, though the figure increase before then because there was a $1200 registration fee and the March tuition was charged on February 28. Then the three spikes and troughs are because daycare increased costs dramatically unless one elected to pay quarterly or annually, so we started paying quarterly so that daycare costs increased “only” 10% per month.
Daycare is the most expensive part of having a child, so it occurred to me to split this figure into two periods, pre- and post-daycare. I then went ahead and made that figure but for our total spending. The logic here is that since our house has not changed since budgeting started, the only major change in costs is the baby, so any changes in monthly spend are attributable to her. Analyzing overall spending also does a better job of capturing the costs of having a child since the baby category does not include food (that goes in groceries), extra eating out costs (eating out), tickets to events like the zoo or puppet theatre (entertainment), or extra vacation costs (vacation). This more comprehensive figure is below, with averages calculated by those three periods – before the baby’s arrival, after but before the start of daycare, and then after the start of daycare.
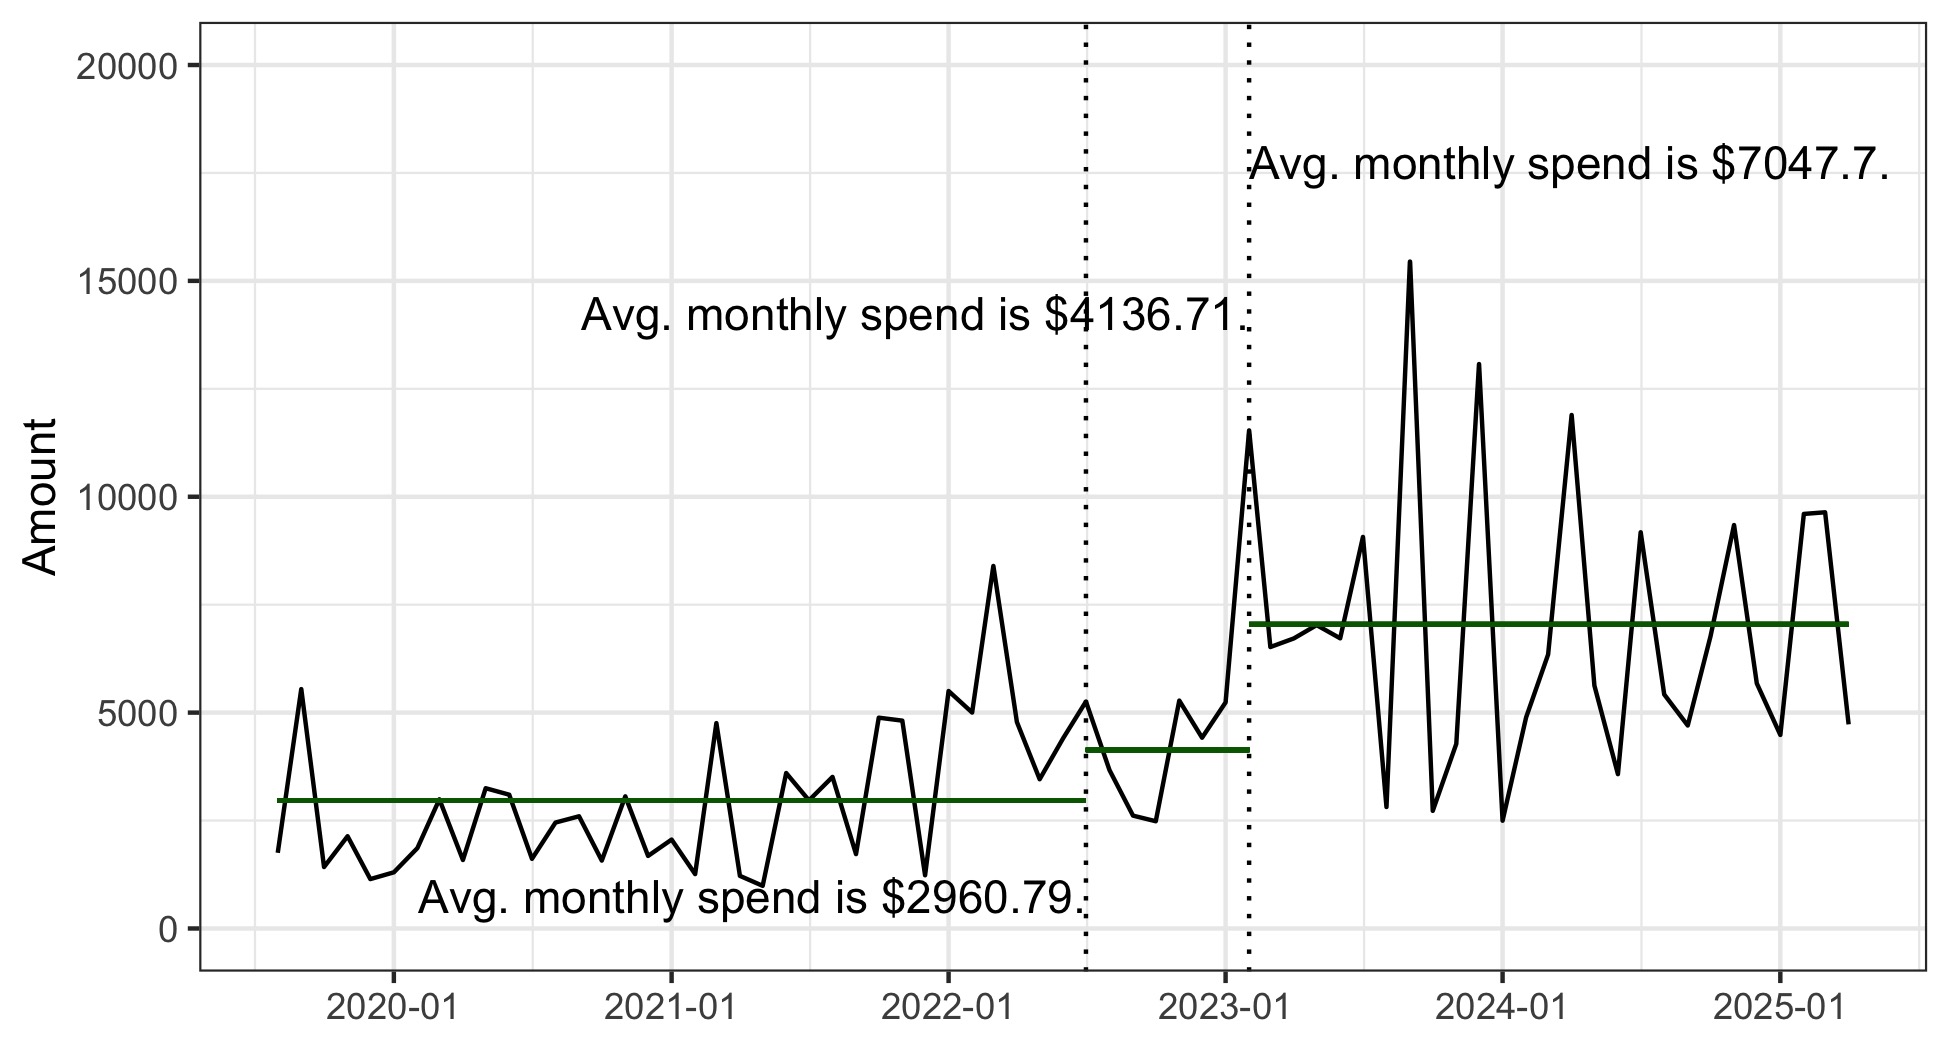
The baby immediately adds $1100 in monthly costs. This seems a bit high; I suspect a lot of it is non-food, non-clothing spending. The jump once daycare starts makes more sense, as that difference is essentially the monthly daycare price. The difference between the third and first period average spending is $4,086.91 per month, or $49,042.92 per year. That’s a lot!
While $4,086.91 is a big number, using absolutes is a bit misleading because income changes. Thanks to cost of living adjustments and raises, my wife and I have been fortunate to have had decent income gains. I therefore redid the figure by making the y-axis the percent of our gross income spent across these categories. That figure is below.
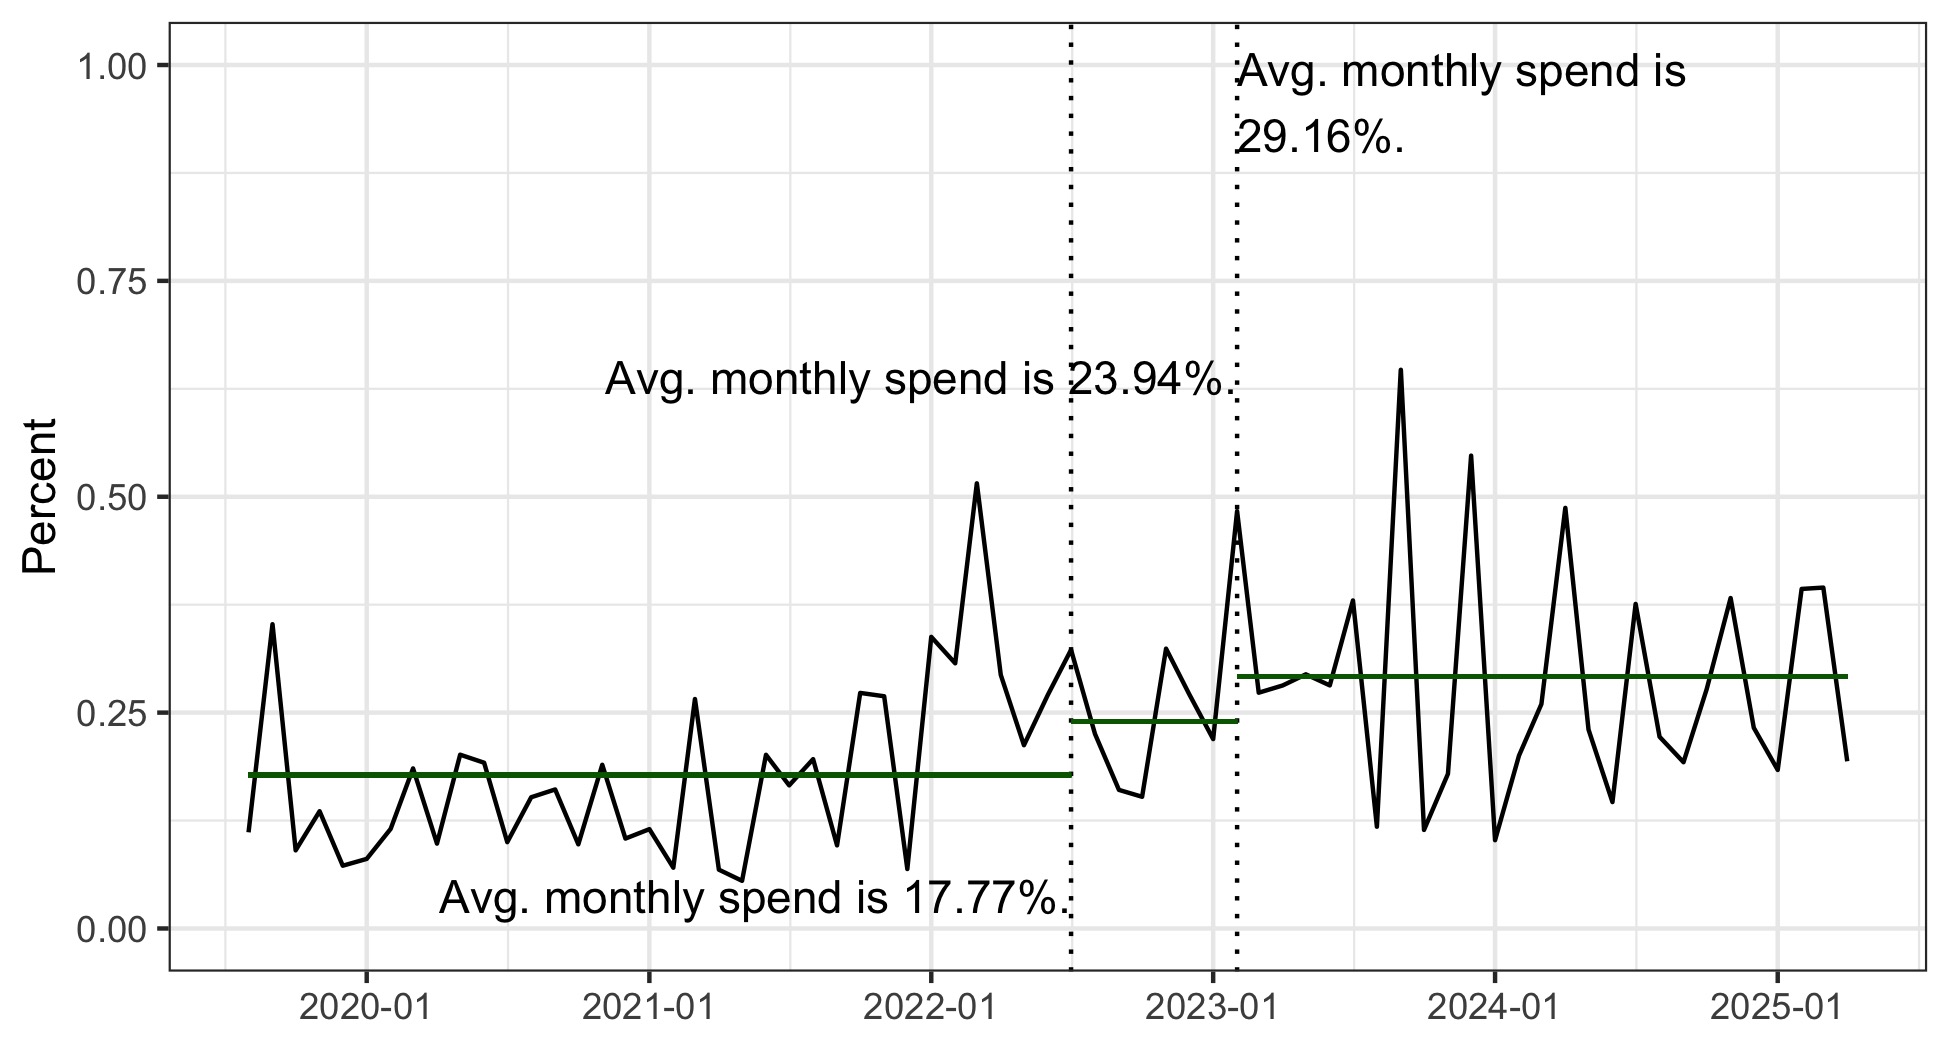
Before our kid, we spend 17.77% of our gross income on everything besides taxes and housing. After, 23.94%, a 34.72% increase. Once daycare starts, the new percent is 29.16%, or a 64.1% increase over the pre-baby spend. That is a huge increase but less than the percentage increase when not adjusting for income, a 138% increase.
$4081.91 per month feels both low and high. On one hand, it is a luxury it is to have this much discretionary income. This number could easily come down by about $1000/month if we used a house based daycare. My wife and I also enjoy eating out and traveling. While we do not take our child to fancy places and use points as much as possible to travel, those two categories are nonetheless large and could be cut if we needed to save money. On the other hand, it is low because we are not saving for college. We just do not have an extra $1000-$2000 per month to save for college, at least not with the costs described two sentences prior.
