
Until recently, Twitter was among the most studied social media platforms in the world. Its accessibility to researchers, coupled with its role in key moments of modern history—from the Arab Spring to the COVID-19 pandemic—made it an indispensable source of data. But in March 2023, the company’s new ownership sharply restricted access to its data, curtailing decades of open inquiry.
I had always wanted to make a dataset about Twitter but not of tweets. It is something I should have done years ago, but pre-tenure was not the right time to do it. No longer having access to fresh tweets but having access to tenure, I decide to make a metadata dataset. Specifically, I have 14.6 billion geolocated tweets from September 2013-March 2023 and 1.7 billion image URLs. After a lot of programming, a graduate student, Elaine Chen, andI converted those raw data to the Twitter History and Image Sharing (THIS) dataset. THIS is public, rich, and compliant with Twitter’s terms of service. So, no tweet text. No usernames. Just aggregate behavior: tweets per country, new user registrations, languages used, image sharing rates. It turns out there’s a lot you can learn without violating anyone’s privacy or contract law.
The dataset is available here: https://dataverse.harvard.edu/dataset.xhtml?persistentId=doi:10.7910/DVN/14WGUG. The paper describing the dataset, what we learn from Twitter, and what we can study as academics is available from the Journal of Quantitative Description: Digital Media here: https://journalqd.org/article/view/8678.
Let’s walk through what the dataset is, how it was made, and some of what we’ve learned from it so far.
What’s in the THIS Datasets?
There are four datasets bundled in THIS:
- Twitter History – Country-Day Panel
- Tweets, users, and languages per country per day (2013–2023).
- Twitter History – New User Registrations
- Date and country of user creation, going back to the platform’s founding in 2006.
- Twitter History – Language Panel
- Tweets per language per country per day.
- Image Sharing
- Number of tweets with images and how many of those images are still available as of early 2024.
These datasets come from real-time downloads using the old streaming API, with a global bounding box to capture geolocated tweets. Only 1–3% of tweets have location data, but since 20–40% of users geotag at least once, it’s a surprisingly rich signal.
Figure 1: Making the THIS Data
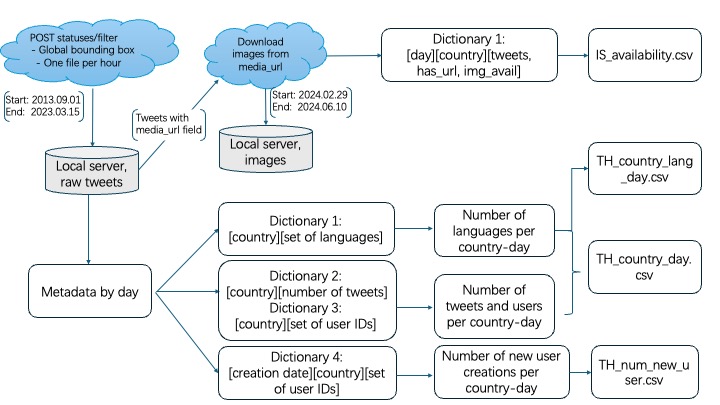
Instead of releasing raw tweets or tweet IDs, THIS aggregates metadata — counts of tweets, languages, image availability — which are permitted and still useful. So instead of asking, “What did this user say?” one asks, “How many users tweeted from Brazil on March 14, 2020, and what language did they use?” That turns out to be useful for a wide range of research.So instead of asking, “What did this user say?” you ask, “How many users tweeted from Brazil on March 14, 2020, and what language did they use?” This THIS metadata turns out to be useful for a wide range of research.
What Can You Do With It?
Let’s start with Twitter’s growth. The dataset includes daily new user registrations back to March 2006. If you graph them, a few clear phases emerge:
Between 2009 and 2017, the platform enjoyed consistent growth, averaging more than 500,000 new users per month. The peak occurred in October 2013, likely driven by major sporting events and storms. From 2017 onwards, user growth slowed markedly. By 2020, a steady decline had begun—a trend that persisted through the end of the collection period.
There is no figure anywhere like Figure 2. As far as we are aware, before this result there was no comprehensive understanding of Twitter’s growth. Data!
Figure 2: Monthly Number of New Users

The number of active users and tweets mirrors this trend, though with some artifacts. For example, a surge in 2014–2015 reflects anomalies in Twitter’s streaming API delivery, not actual usage. You can see this in both our data and discussions among API developers from the time.
The number of countries represented in the data also rose steadily, peaking at 240 in 2015. This rapid geographic diffusion, preceding the platform’s peak in total users, suggests that Twitter’s initial growth was driven more by expansion into new markets than by saturation within them.
The paper also examines cross-national variation. Unsurprisingly, the U.S., Brazil, and Japan account for nearly half the tweets. But Twitter’s geographic reach is vast—over 240 “countries”, with quotation marks because that is the word Twitter uses but the service includes dependencies and areas of contested sovereignty.
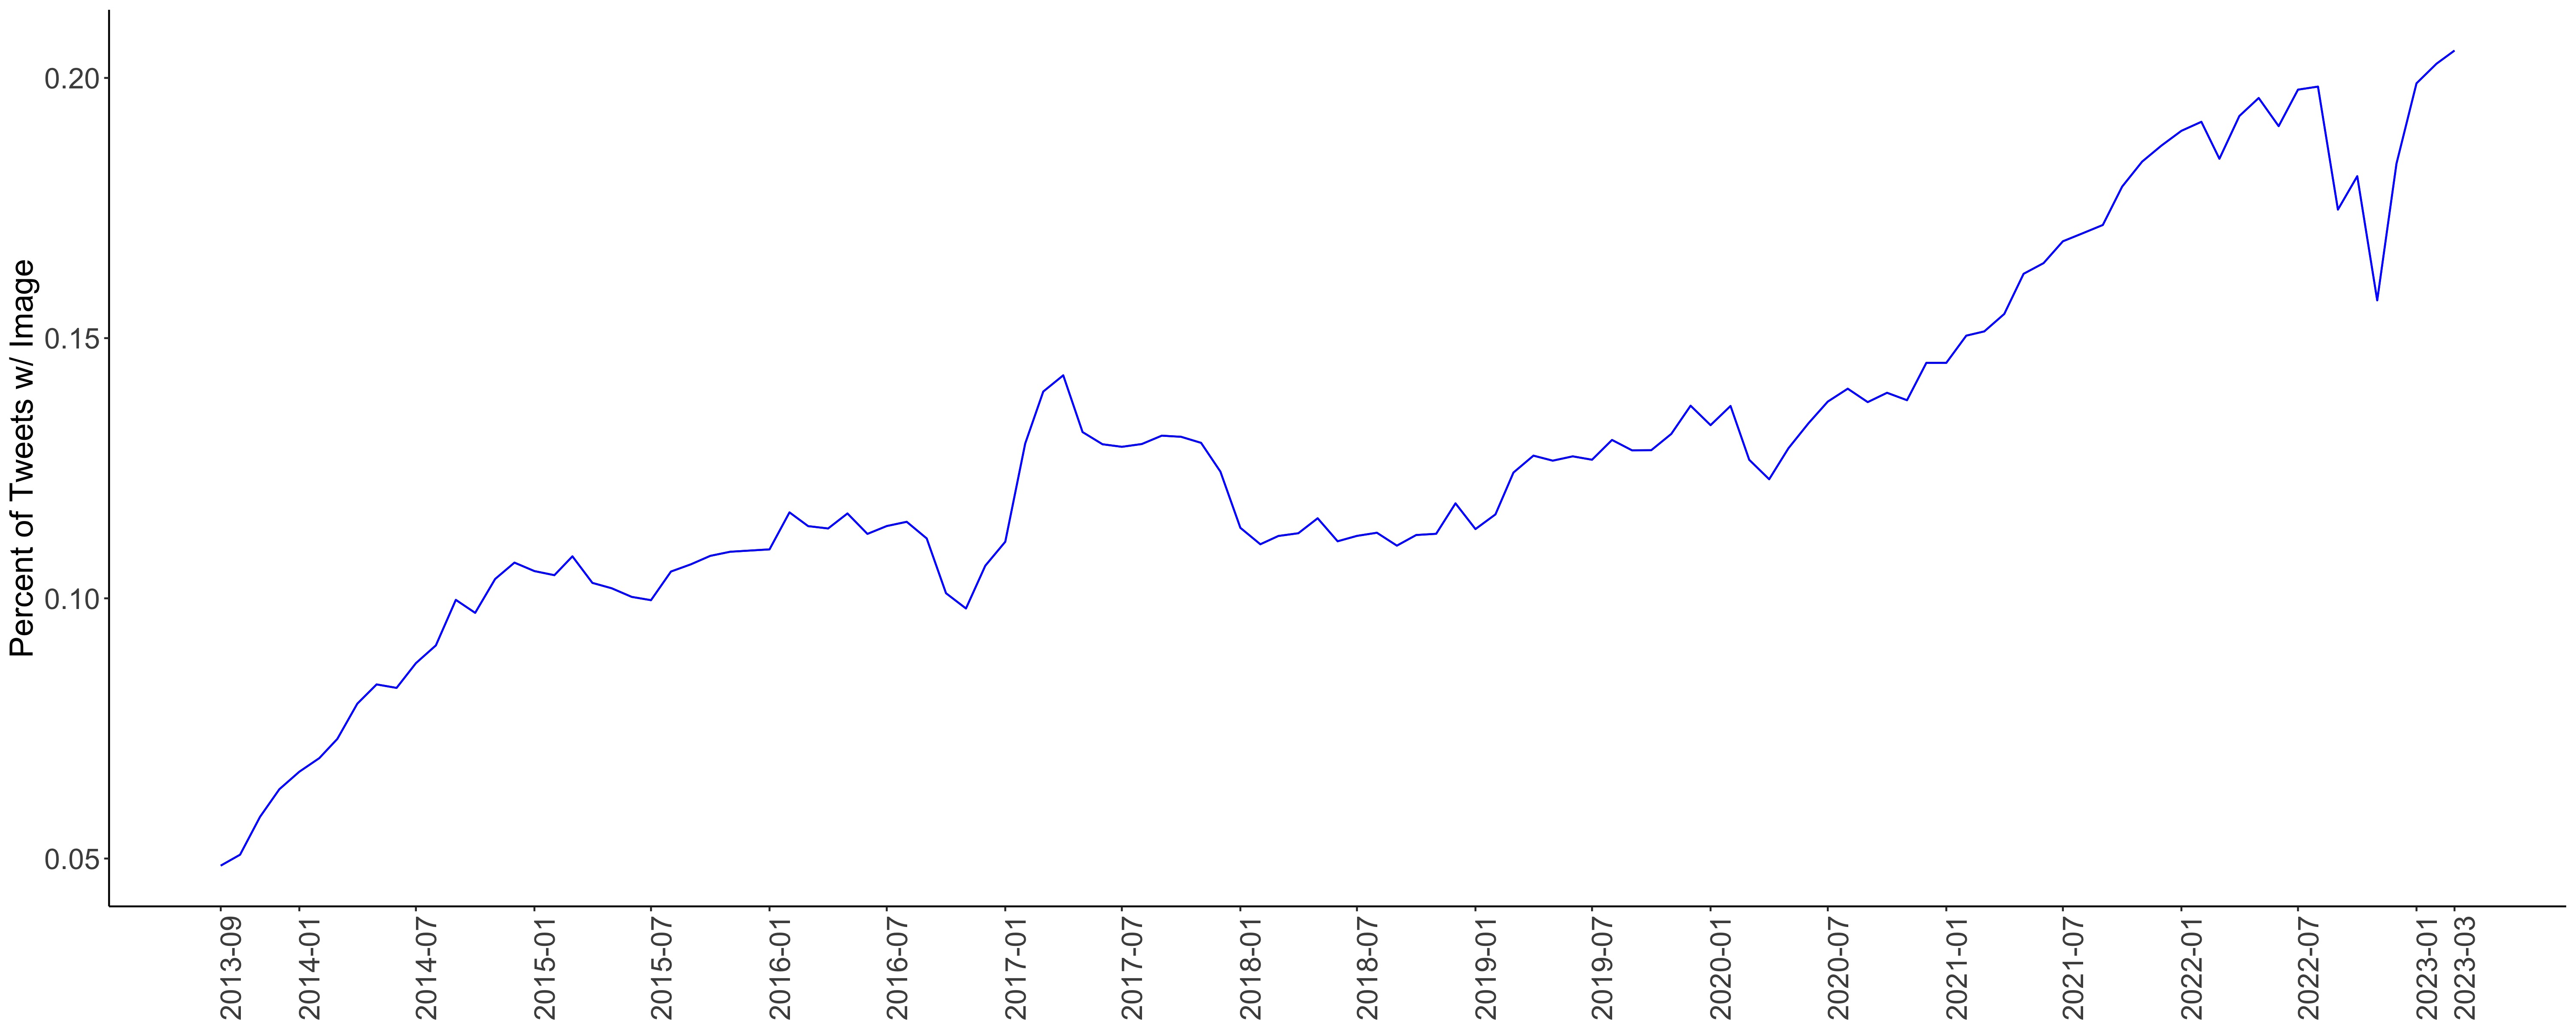
One unique contribution of the THIS dataset is its focus on image sharing. Of the 14.6 billion tweets collected, 1.7 billion included images, of which 956 million were still available at download in early 2024. This variation allows for systematic analysis of how visual content on Twitter has evolved and eroded over time.
As Figure 3 shows, in 2013, only 5% of tweets contained an image. By early 2023, that figure had reached 20%, with two distinct phases of growth: 2013–2015 and 2019–2022. Image-sharing behavior varies widely across countries. China, Myanmar, and Taiwan had the highest share of image-containing tweets, while countries such as Cameroon and Turkmenistan shared images far less frequently.
Figure 3: Percent of Tweets With Images
We checked whether image availability varies across countries – it does. Image availability declines steadily with time—by approximately 7.5% per year—consistent with prior studies on “tweet rot.” Notably, image disappearance appears negatively correlated with freedom of expression indices. Countries with greater academic or cultural freedoms exhibit higher rates of image persistence. However, one counterintuitive finding is that greater freedom of discussion for women correlates with lower image retention. This result, unexplained by the current analysis, suggests further investigation is warranted.
Below is another figure from the paper comparing image sharing in China, Hong Kong, and Taiwan. Look at the initial similarities then clear different behavior from China and some separation of Hong Kong and Taiwan. (Twitter labels these lands as separate countries.) How cool is that!
Figure 4: Percent of Images Still Available

Twitter Behavior is Real Behavior
By design, the THIS datasets are particularly well-suited to comparative analysis. Since all tweets are geolocated, it becomes possible to observe the interplay between offline events and online behavior. In the Middle East and North Africa, for instance, the data capture a clear spike in Twitter adoption during the Arab Spring. In China, user activity rose in response to COVID-19 lockdowns. In Russia and Ukraine, new users joined Twitter during the latter’s 2013-14 Euromaidan protests and around Russia’s 2022 invasion, though by that point from a low base.
Figure 5: Ukraine and Russia Trends in New Users

In countries where Twitter is blocked outright—including China, Iran, and Myanmar—usage continues nonetheless, likely due to VPNs. The authors note that while VPNs can conceal users from governments, they do not affect the location metadata reported by Twitter’s API, which is tied to the device rather than the transmission route.
Figure 6: Tweets From Countries Where Twitter is Blocked

Quick Analyses
To showcase the possibilities, the paper showcases four uses.
- Elections: Comparing new user registrations 31 days before vs. after elections. Only Singapore 2020 showed a clear uptick before. Elsewhere, user registrations mostly rise after an election. A reminder that our intuitions don’t always match behavior.
- Image disappearance: Tweets with images are more likely to vanish in places with greater freedom of expression for women. Huh? Not what we expected. Other press freedom variables don’t do much. This is a puzzle for future work.
- Event detection: Take a rolling average of tweets per country and find outliers. The top 50 dates include earthquakes, political protests, and even regional storms. Twitter, it turns out, is a decent seismograph.
- Digital repression: In countries where Twitter is blocked, temporarily or permanently, there are still a lot of tweets and users from there. VPNs are powerful.
Limitations and Last Thoughts
The data have the usual caveats: geotagging is opt-in, and Twitter users are not representative of the general population. This socioeconomic bias does not necessarily mean that all studies using geolocated tweets will be biased. It is a standard seminar show of seriousness to suspect sample bias issues, but what is often overlooked is that selection bias only matters if the selection is correlated with variables of interest. For example, Twitter data are often used to study information diffusion, and we are aware of no theory or evidence that shows why geolocated Twitter users will spread information differently than non-geolocated ones or people not on Twitter. Moreover, many research questions are focused on what is known as theory application research, research into behaviors that should be generally applicable across subpopulations; in these cases, convenience samples, such as Twitter users, can be used. While researchers should always think carefully about selection bias, much less attention is paid to if that selection bias correlates with the outcome of interest; often, it does not.
The THIS dataset fills a widening gap in the research community’s ability to study digital behavior at scale. As Twitter has moved away from data transparency, and as other platforms erect similar barriers, projects such as THIS become essential. While the dataset does not include text or user-level metadata, its temporal and geographic breadth allows for rigorous analysis of trends, shocks, and structural variation across time and place.
In that sense, the dataset is as much a historical archive as it is a research tool. It captures a decade of digital traces—some still visible, others already lost—and offers a foundation for future inquiry. So if you want to study digital politics, protest, platform behavior, or just Twitter itself, now you can.
