
Working with events data has long posed a fundamental dilemma. On one hand, the events one wants to study – state-sponsored killings, battles in a war, or protests, for example – have a complex, intertwined nature that requires either detailed case studies or detailed hand-coding of the events. On the other hand, gathering such detailed coding makes it difficult to analyzes events in different time periods or places, a problem for those interested in creating generalizable theories. Scholars preferring the latter approach – coding many events in different locations at different times – have relied on computer-generated events data, with newspapers providing the raw material for the events data.
The Global Database of Events, Language, and Tone (GDELT) is the most recent computer-generated events database and has recently received some attention concerning the accuracy of its coding. This post analyzes GDELT’s data from three different angles to argue that computer-generated events data is quite accurate, so long as one’s goal is not to measure the True number of events for one’s study. GDELT’s recording of Arab Spring protests compares favorably to hand-coded events dataset, and a cross-sectional comparison of GDELT’s protests figures matches actual events during the Arab Spring.
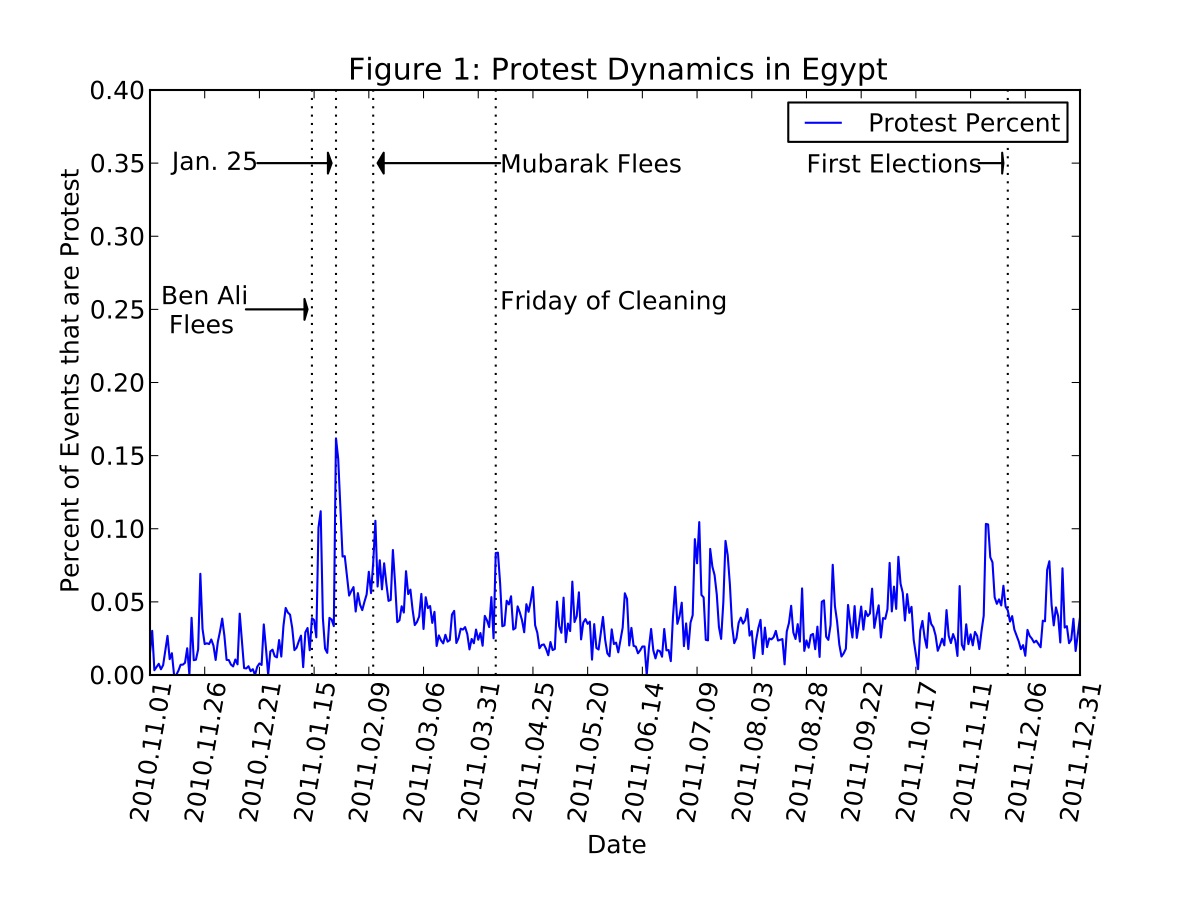
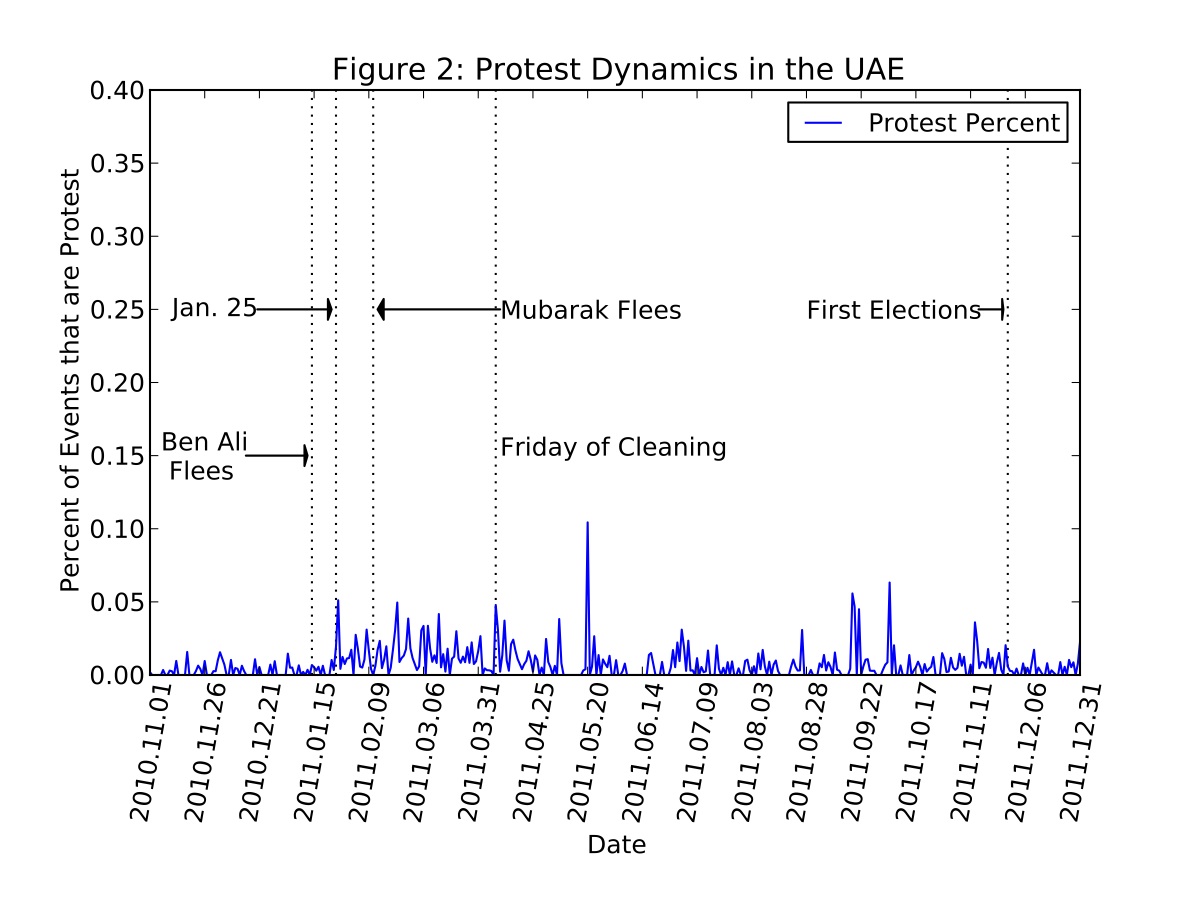
One concern is that events data, including GDELT, will have high variance. Newspapers may underreport events when the topic is not sexy and overreport once the event dominates the news cycle. This does not appear to be the case with GDELT during the Arab Spring. Looking at protests recorded in Egypt and the United Arab Emirates from November 1st, 2010 through the end of 2011, GDELT clearly has records for protests on days when Western media were not focusing on the Arab Spring, especially before the start of major protests in Egypt on January 25th. While all the records come from news articles, the ones before January 25th probably come from sources more focused on, and therefore providing more accurate tallies of protest in, the Middle East and North Africa. In other words, the news sources GDELT follows appear to have broad enough coverage to not bias events to just periods when those events become recognized by Anglo-Saxon newspapers. The extensive temporal recording of protests suggests that subsequent increases in recorded protests are true protests and not the result of having more reporters in those countries.
Second, Figures 1 and 2 demonstrate that GDELT records different levels of protest in countries that did have different levels of protest. Figure 1 plots the protests to events ratio in Egypt, Figure 2 for the United Arab Emirates, both at the country level. (Protests were chosen as any event with a GDELT EventRootCode equal to 14.) Dividing the specific event of interest (protests) by the all events recorded ensures that any observed increase in the specific event is not an artifact of the sudden attention from news media that event receives. The figures show that GDELT records protests every day in Egypt, a high activity country, and almost every day in the United Arab Emirates, which experienced very little unrest. The data also shows spikes in protests around days that are understood to have experienced a lot of protest, and these spikes occur only around relevant events for Egypt and the United Arab Emirates. For example, Egypt experiences no uptick in protests when Tunisian President Ben Ali flees, but subsequent protests clearly track major events. The chart for the UAE shows some evidence of heightened protest activity, but none appear to track the events in Egypt.
Third, I have compared GDELT’s protest counts to turnout at organized demonstrations, spontaneous demonstrations, organized violent riots, and spontaneous violent riots as recorded in the Social Conflict in Africa Dataset (SCAD). SCAD is a hand-coded events dataset of major conflictual events in Sub-Saharan Africa from 1990-2011. Because SCAD focuses on Africa, the charts below are limited to protests in Morocco, Algeria, Tunisa, Libya, and Egypt. SCAD’s number of participants measure ranges from 1-7 in increments of powers of 10 (0-9, 10-100, 101-1,000, etc.). Figure 3 shows the correlation between number of protests in a country with the number of protestors at organized demonstrations, spontaneous demonstrations, organized violent riots, and spontaneous violent riots. Figure 3 is for events SCAD identifies as having occurred nationwide, Figure 4 for those only at the city level.

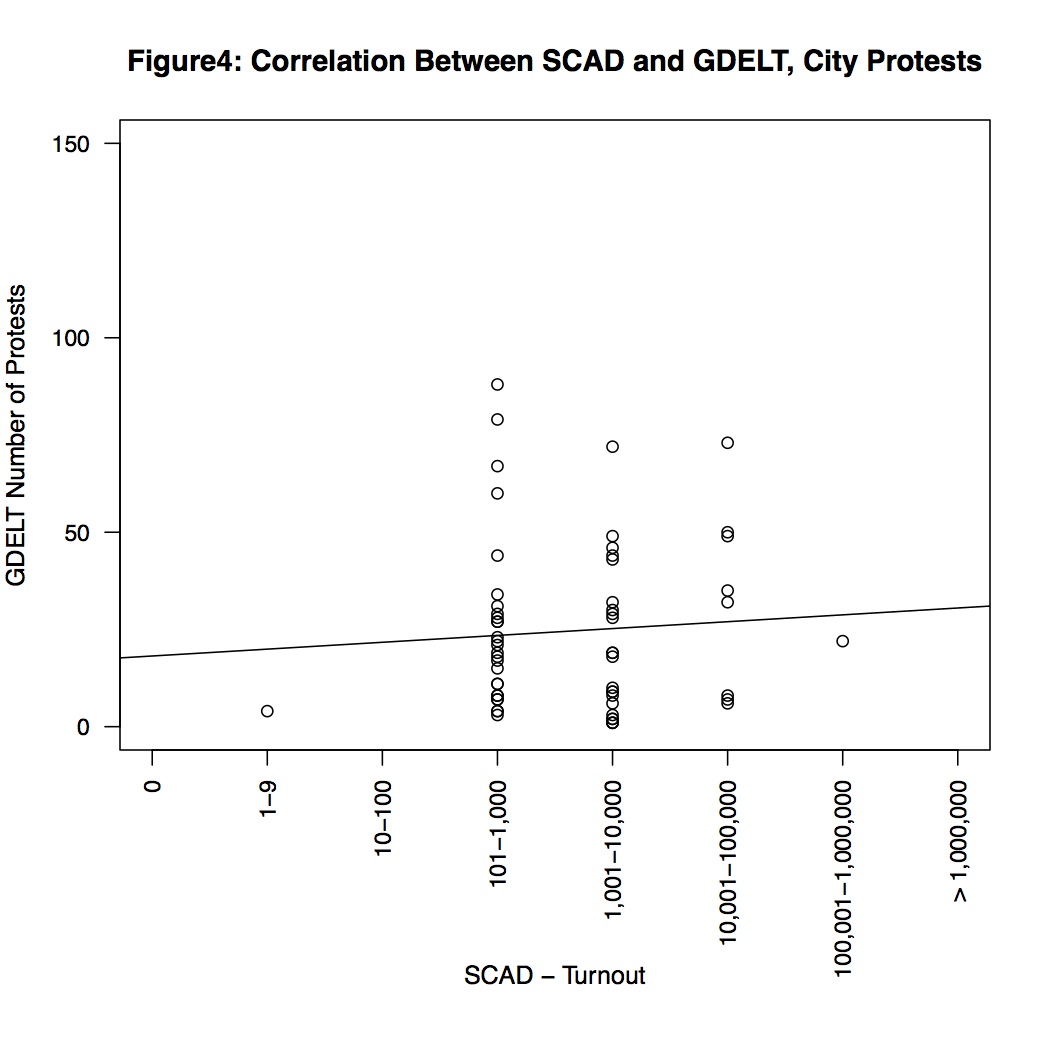
Both charts demonstrate a positive correlation between how many protests GDELT records and how many participants SCAD records. GDELT does not attempt to measure protest turnout, and SCAD does not record enough events to compare to GDELT. Assuming that more protests in a day correlates with more people protesting that day, this comparison is as close a validation to GDELT as possible. Moreover, the construction of the SCAD turnout measure reduces the possibility of finding any correlation because it compresses whatever the “real” level of turnout was to identical or very similar values. (To be fair, SCAD does this because measuring turnout is imprecise and articles report conflicting, very different, values.) Any resulting association found can therefore be interpreted as a worst-case estimate of the correlation between the two measures.[1]
The Arab Spring was one of the most reported events of 2011, and it caught most observers by surprise. If any news-based events dataset, including GDELT, is likely to misreport events, protests during the Arab Spring therefore seem like as good a candidate as any. That GDELT appears to have accurately captured protest behavior during the Arab Spring, at least as much as can be expected without having infinite coding resources, is reassuring to those who make use of computer-coded events data. No one will ever know precisely how many distinct protests occurred in Egypt on January 25th or Sana’a on January 27th, much less how many protestors participated. It appears, however, that we can trust machine-coded reports of these events in our research.
[1] GDELT eliminates all records it creates that have the same values for date, source, target, and event, removing about 20% of initial observations. When these duplicates are found, the event’s values for number of articles, number of mentions, and number of sources are updated. The remaining rows should therefore each represent unique protests (or whatever event in which the research is interested).

Of potential interest:
1. A contribution from @MDWlab comparing ICEWS and GDELT (both automated):
M.D. Ward; A. Beger; J. Cutler; M. Dickenson; C. Dorff; B. Radford “Comparing GDELT and ICEWS Event Data,” Report , 2013
2. An oldie (not necessarily a goodie) discussing trade-offs between hand coded and automated coded: Davis, David R., Brett Ashley Leeds and Will H. Moore. 1998. “Measuring Dissident and State Behavior: The Intranational Political Interactions (IPI) Project,” presented at the Workshop on Cross-National Data Collection, Texas A&M University, November 21 .
Shoot, the URLs got lost. Trying again:
1. http://mdwardlab.com/biblio/comparing-gdelt-and-icews-event-data
2. http://mailer.fsu.edu/~whmoore/garnet-whmoore/ipi/harmel.conf.pdf
It’s worthwhile to note that SCAD is also drawn from news reports (AFP and AP). So the latter assessment checks whether the machine-coding picks up the same variations in protest activity as reported in news wires.